Debugging Methods for Linux Servers
or
The Art of Firefighting
Jeff Poole
https://korvus81.github.io/debugging-talk/
(press '?' for help, use 'N'/'P' to navigate)
Who am I?
- Software developer at Vivint on the core platform team
- Previously VoIP developer at Jive Communications
- Before that, a mix of software and hardware (VHDL)
- Coding professionally since 1997 (if you count VB...)
- Production server firefighter, by nature
- (former skydiver, EMT, and adrenaline junkie)
Agenda
- Intro
- Localizing the problem to a machine
- Triage of a machine
- Making sense of the data
What is this about?
Everything was working fine.
Suddenly something is wrong. Users are reporting problems. Or your internal metrics are setting off alerts.
You need to find the problem to either stop things before they get bad, or to limit the scope of the outage.
This isn't about code that never worked, or what to do if you know a disk just died, but about finding the root cause of your problem so it can get fixed.
Who is this for?
My philosophy:
When things are failing in production, both development and operations work together until the problem is well-defined.
Operations needs to provide support even if they think it is probably a code issue
Developers own their code in production, and even if it turns out to be a problem in the operations realm (say, hardware failure), they need to own making sure everything is working once the problem is fixed
We cross boundaries -- teams that have firm walls between the two groups have a fundamental problem
(once again, this is just my opinion)
Don't Panic
No matter how bad things are, panic only makes things worse
We have information on how to train people for high pressure jobs (military, emergency medicine, etc):
- Have a checklist/algorithm
- Practice using that algorithm in realistic situations
- Keep practicing until you can do it without thinking
- When faced with a crisis, you do what you've already done a thousand times instead of freaking out
- Panic creates brain fog and makes us dumb -- training does the opposite
The approach
- Figure out what machines to look at
- Initial tests to find the most likely causes of failures
- Use the tools we have available on Linux systems to confirm the issue
This is heavily based on my own biases and experience.
This is what works for me.
Your mileage may vary.
A quick comment on monitoring
This is not a talk on monitoring/instrumentation
I am going to assume you have some sort of system and application metrics
If you don't monitor your servers and code in production, you need to start ASAP -- it's like driving with your eyes closed
If you are monitoring-impaired, some quick suggestions:
For logs, the ELK stack (ElasticSearch, Logstash, Kibana) is a great place to start. Send your logs there. Set up properly, you can see in Kibana that something is suddenly logging a lot, and drill down to see what server/process it is and what the logs are.
For metrics, Graphite is a good default choice. Run collectd on your machines to get system-level metrics (CPU, memory, disk, etc), and probably put some form of StatsD server between your code and Graphite/Carbon (Carbon being the metrics ingestion part of Graphite). Instrument your code with anything that can report via StatsD. Alternate options include the Influx stack and Prometheus.
For deciding when to alert, if you don't already have a monitoring setup, there are several tools that can turn Graphite metrics into alerts, based on thresholds. Or you can use a traditional monitoring tool like Zabbix or Nagios. There are paid platforms as well.
For alerting teams, PagerDuty and VictorOps both seem to be solid (paid) platforms. If you want to roll your own, Twilio is probably the easiest way to get SMS/phone integration.
Localizing the problem to a machine

Sometimes the symptom makes it obvious. Or you've seen this problem before. If so, you don't need this step. Proper monitoring/instrumentation can help here.
Otherwise the approach is to follow the path of a request, looking in the logs until you see a problem.
If the logs don't make it obvious, repeat with some of the system analysis tools we will discuss later to see if any servers are struggling.
Example
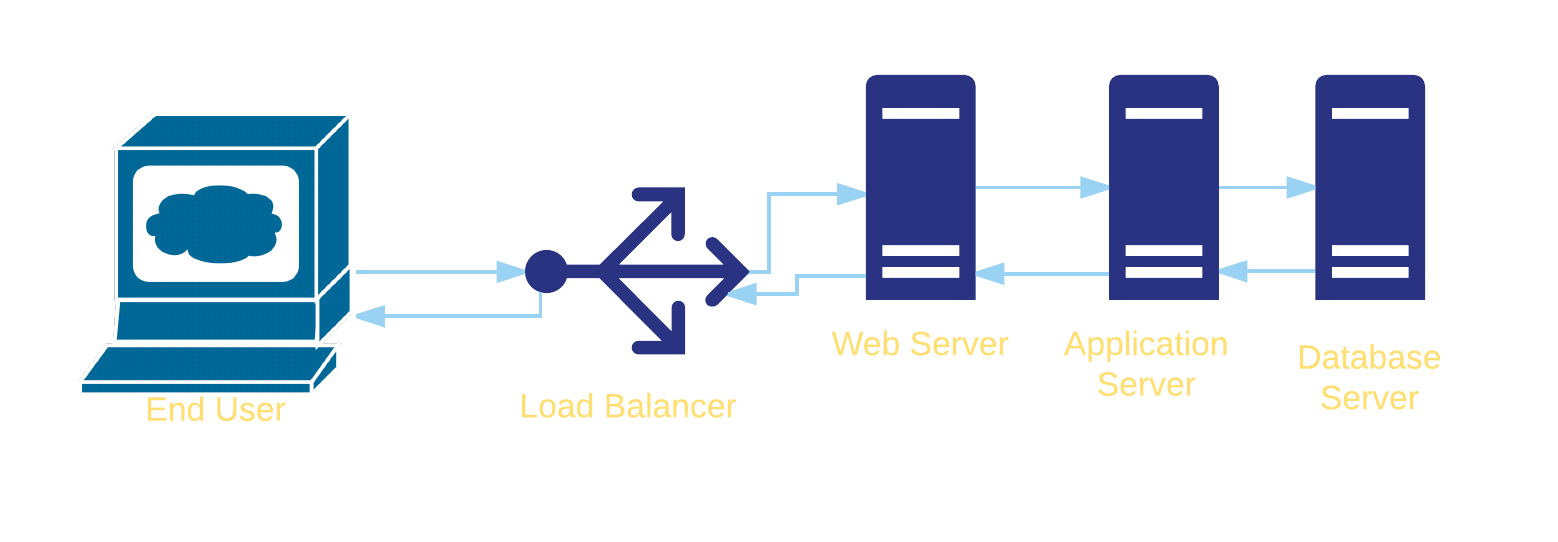
- Symptom: an HTTP request is returning a 500 error
- Look at the logs on the load balancer to see if it is forwarding the request or producing an error
- Look at the logs on the web server to see if it is forwarding the request or producing an error
- Look at the application server logs to see if it is producing an error or receiving an error from the database
Example
You don't have to look at every step -- if you can tell from the web server if it is getting the request from the load balancer, you can skip the load balancer.
If you can tell the request is getting to the application server without looking earlier, start there.
Example
You can do similar things with metrics for performance problems -- if responses are slow and you have average times of 800ms at the balancer, 760 ms at the web server, 750 ms at the application server, and 10 ms to the database, the application server should be top of your list.
Example
Inconsistent performance is best found through metrics systems -- then you can see which of your app servers has slower responses or higher CPU usage to guide the search.
Triage of a machine

Initial tools:
uptimedf -htopdmesg | tailvmstat 1mpstat -P ALL 1iostat -xz 1free -msar -n DEV 1sar -n TCP,ETCP 1
Based heavily on Brendan Gregg's talks, latest: SRECon 2016
* Some of these require sysstat or other packages installed, some need to be run as root
uptime
> uptime
 23:51:26 up 21:31,  1 user,  load average: 30.02, 26.43, 19.02
The uptime command gives a few useful pieces of information. First, up 21:31 tells you how long it has been since the server started. If this number is small and shouldn't be, that's a big red flag.
uptime
> uptime
 23:51:26 up 21:31,  1 user,  load average: 30.02, 26.43, 19.02
Next are the load averages. These are three numbers representing the average number of processes running or waiting to run, using a 1-, 5-, and 15-minute exponential moving average.
As a rule of thumb, if these numbers are larger than the number of cores on your system, you are CPU-limited.
With three values for the load, you can determine the pattern -- in this case (30.02, 26.43, 19.02), the load has been going up. If you see something like 8.13, 26.43, 10.02 that is a sign that something WAS saturating the CPU, but either stopped or crashed.
df -h
> df -h
Filesystem            Size  Used Avail Use% Mounted on
/dev/cciss/c0d0p2      75G   23G   49G  32% /
/dev/cciss/c0d0p5      24G   22G  1.2G  95% /home
/dev/cciss/c0d0p3      29G   25G  2.6G  91% /data
/dev/cciss/c0d0p1     289M   22M  253M   8% /boot
tmpfs                 252M     0  252M   0% /dev/shm
This command shows the free disk space on all mount points. If anything that isn't read-only is >95% in the Use% column, suspect out of space problems.
top
> top
top - 20:59:42 up 132 days,  9:17,  1 user,  load average: 1.11, 1.01, 0.83
Tasks: 961 total,   3 running, 958 sleeping,   0 stopped,   0 zombie
Cpu(s): 23.2%us,  2.6%sy,  0.0%ni, 73.3%id,  0.0%wa,  0.0%hi,  0.9%si,  0.0%st
Mem:  10120440k total,  9555236k used,   565204k free,   217136k buffers
Swap:  4063228k total,    27400k used,  4035828k free,  3144332k cached

  PID USER      PR  NI  VIRT  RES  SHR S %CPU %MEM    TIME+  COMMAND
59406 nobody    20   0  216m  68m 3528 S 18.2  0.7 892:38.13 python
59172 nobody    20   0  416m  81m 3124 S 17.9  0.8 594:42.70 python
...
Running top can give you a quick view into load, CPU usage, memory/swap, and what processes are taking the most CPU (%CPU) and/or memory (%MEM -- running top -a will sort by memory).
Great command for a quick overview, but if the problems aren't obvious here, the rest of the commands will provide more detail.
If you have trouble catching the patterns in the process output, consider running pidstat 1 which prints a new list each second.
dmesg | tail
> dmesg | tail
[567923.472220] python invoked oom-killer: gfp_mask=0x280da, order=0, oom_score_adj=0
[...]
[567923.472400] Out of memory: Kill process 14745 (python) score 226 or sacrifice child
[567923.472408] Killed process 14745 (python) total-vm:1771392kB, anon-rss:1753348kB, file-rss:0kB
[615755.954447] TCP: Possible SYN flooding on port 8080. Dropping request.  Check SNMP counters.
This shows the last ten lines of the kernel's ring buffer. Important messages involve the oom-killer (Out Of Memory killer -- kills processes when the system is running out of memory), network issues, and various hardware problems (such as drive timeouts or errors).
Sometimes it is also worth looking at /var/log/messages and/or /var/log/syslog depending on the distribution -- they sometimes have equally enlightening messages.
vmstat 1
> vmstat 1
procs -----------memory---------- ---swap-- -----io---- --system-- -----cpu-----
 r  b   swpd   free   buff  cache   si   so   bi    bo   in   cs us sy id wa st
 6  0 558192 380116  35992 9740312   2    1   80   266    1    0 14  5 81  0  0
 9  0 558192 378604  35992 9743408   0    0  204 21904 3029 2943 19  4 77  0  0
11  0 558192 377380  35992 9746736   0    0  692     0 2796 3083 19  5 77  0  0
^C
Short for "virtual memory stat", the 1 parameter tells it to print out a summary every 1 second. Like most of the sysstat utilities, the first line is generally an average since boot and the following lines are the 1-second updates.
vmstat 1
> vmstat 1
procs -----------memory---------- ---swap-- -----io---- --system-- -----cpu-----
 r  b   swpd   free   buff  cache   si   so   bi    bo   in   cs us sy id wa st
 6  0 558192 380116  35992 9740312   2    1   80   266    1    0 14  5 81  0  0
 9  0 558192 378604  35992 9743408   0    0  204 21904 3029 2943 19  4 77  0  0
11  0 558192 377380  35992 9746736   0    0  692     0 2796 3083 19  5 77  0  0
^C
procs/r: # of processes running and waiting for a turn to execute. Unlike load averages, this does not include processes waiting for I/O. Should be < # of cores.memory/free: Free memory in kB.swap/{si|so}: Swap-in and swap-out events -- should be zero unless you are out of memorycpu/{us|sy|id|wa|st}: Average across cores for user, system, idle, I/O wait, and stolen CPU time. High user+system indicates CPU saturation, high I/O wait indicates a disk bottleneck and high system time can indicate I/O issues as well.
mpstat -P ALL 1
> mpstat -P ALL 1
02:31:49 PM  CPU   %usr %nice  %sys %iowait  %irq %soft %steal %guest   %idle
02:31:50 PM  all  36.47  0.00  3.61    0.00  0.00  0.25   0.00   0.00   59.67
02:31:50 PM    0  67.01  0.00  6.19    0.00  0.00  8.25   0.00   0.00   18.56
02:31:50 PM    1  58.00  0.00  2.00    0.00  0.00  0.00   0.00   0.00   40.00
...
02:31:50 PM   30  23.23  0.00  0.00    0.00  0.00  0.00   0.00   0.00   76.77
02:31:50 PM   31  23.00  0.00  0.00    0.00  0.00  0.00   0.00   0.00   77.00^C
This prints the breakdown of activity by CPU. The 1 prints every second and -P ALL shows activity for all cores (default is a summary of all cores only, like the first line of this output).
Can indicate processes with insufficient parallelism if one or two cores are saturated while the rest are idle.
For example, Redis is single-threaded, so a server running Redis may be mostly idle but one core might be near 100% usr+sys time, indicating that our single-threaded process is CPU-limited.
iostat -xz 1
> iostat -xzm 1
Linux 2.6.32-573.18.1.el6.x86_64 (unnamed.server.com) 	07/04/2016 	_x86_64_	(32 CPU)

avg-cpu:  %user   %nice %system %iowait  %steal   %idle
          13.84    0.00    4.66    0.17    0.00   81.33

Device: rrqm/s wrqm/s    r/s    w/s  rMB/s   wMB/s avgrq-sz avgqu-sz
sda      11.36  10.66 376.16 396.06   5.09   16.96    28.57     0.62
dm-0      0.00   0.00  19.22   8.51   0.15    0.06     8.00     0.01
dm-1      0.00   0.00 367.89 390.75   4.92   16.83    28.68     0.62
                                                    await svctm %util
                                                     0.81  0.08  6.32
                                                     0.49  0.05  0.15
                                                     0.82  0.08  6.19
The iostat utility shows disk I/O. As usual, the 1 tells it to give us 1-sec updates, while -x provides "extended statistics" and -z only shows devices that have had activity in the summary period.
Note that sometimes this tool can provide inaccurate results if you are on a virtualized or logical block device, since the OS doesn't have the full picture of the capacity nor utilization of the device.
iostat -xz 1
> iostat -xzm 1
...
Device: rrqm/s wrqm/s    r/s    w/s  rMB/s  wMB/s avgrq-sz avgqu-sz
sda      11.36  10.66 376.16 396.06   5.09  16.96    28.57     0.62
                                                   await svctm %util
                                                    0.81  0.08  6.32
r/s, w/s, rMB/s, wMB/s: The # of reads, writes, read MB and write MB delivered to the device per second.await: Average time for the I/O in ms. This is the time the application has to wait, including time while the operation is queued and the time taken for it to execute.avgqu-sz: The average number of requests issued to the device -- values greater than 1 can be a sign of saturation%util: This is the % of time that the device was busy doing work. Values >60% typically lead to poor performance, while values near 100% indicate saturation
free -m
> free -m
             total       used       free     shared    buffers     cached
Mem:        193582     189612       3970          1         33      95379
-/+ buffers/cache:      94199      99383
Swap:        20479        559      19920
Shows memory numbers in MB (per -m). You want buffers (block device cache -- filesystem metadata and pages going to/from disk) and cache (filesystem cache -- contents of files) to be >0 -- buffers can be pretty small (>10M), but cached should be at least 100M on all but the smallest servers. If those numbers get too small, it can cause higher disk I/O (visible in iostat) and lower performance.
Since the OS can free memory in the caches, the -/+ buffers/cache has the most useful data to determine much memory is free -- in this case, just over half of the memory is effectively free, if needed.
sar -n DEV 1
> sar -n DEV 1
Linux 2.6.32-573.18.1.el6.x86_64 (example.com) 07/04/2016 _x86_64_ (12 CPU)

08:18:35 PM IFACE  rxpck/s  txpck/s   rxkB/s   txkB/s  rxcmp/s txcmp/s rxmcst/s
08:18:36 PM    lo   169.66   169.66  1812.83  1812.83     0.00    0.00     0.00
08:18:36 PM  eth0  4501.12   574.16  2352.18    37.01     0.00    0.00     0.00

08:18:36 PM IFACE  rxpck/s  txpck/s   rxkB/s   txkB/s  rxcmp/s txcmp/s rxmcst/s
08:18:37 PM    lo   190.91   190.91  2273.33  2273.33     0.00    0.00     0.00
08:18:37 PM  eth0   294.32   134.09   204.17    33.65     0.00    0.00     0.00
^C
The sar command is another part of the sysstat package. Calling it with the 1 parameter and the -n DEV flag combined returns 1-sec network interface throughput stats.
In particular, rxkB/s and txkB/s show the current throughput, which can be used to assess the work being done by the server and if a network interface is close to being saturated
sar -n TCP,ETCP 1
> sar -n TCP,ETCP 1
Linux 2.6.32-573.18.1.el6.x86_64 (example.com) 07/04/2016 _x86_64_ (12 CPU)

08:35:52 PM  active/s passive/s    iseg/s    oseg/s
08:35:53 PM      1.03      3.09  74083.51   9437.11

08:35:52 PM  atmptf/s  estres/s retrans/s isegerr/s   orsts/s
08:35:53 PM      0.00      0.00      0.00      0.00      0.00

08:35:53 PM  active/s passive/s    iseg/s    oseg/s
08:35:54 PM      1.01      3.03    328.28    329.29

08:35:53 PM  atmptf/s  estres/s retrans/s isegerr/s   orsts/s
08:35:54 PM      0.00      0.00      0.00      0.00      0.00
^C
Calling sar with -n TCP,ETCP 1 returns 1-sec TCP stats.
active/s: # of locally-initiated TCP conn/sec (viaconnect())passive/s: # of remotely-initiated TCP conn/sec (viaaccept())retrans/s: # of TCP retransmissions/sec
Making Sense of the Data
What does it all mean???

Symptoms
The pattern of symptoms can indicate the disease
I will describe examples of failures I have seen, which will (hopefully) be useful in helping you recognize what might be going on in the future.
Note that a historical view of data (what is normal, how the parameters changed over time) is incredibly useful -- once again, a good metrics/instrumentations system can be critical
Examples
- Java program leaking memory -- increase in memory usage (keep in mind that the JVM has it's own heap limit, so the server may still have free memory -- get metrics from JMX), followed by an increase in user CPU as it gets harder and harder for the garbage collector to find memory to free. Other garbage-collected languages may exhibit this behavior, though most don't have Java's VM limitation on heap size, so a memory leak might be most visible as a decrease in server free memory.

Examples
- Carbon (Graphite's metric collector) doesn't have enough CPU available -- As Carbon becomes CPU-bound (like many Python programs it has limited parallelism in a given process, so it maxes out around one full core -- 100% CPU), it also starts growing in memory usage since it can't flush metric data to disk fast enough. Eventually, the oom-killer will kill the process, though it will be ineffective long before then. Importantly, the problem here is CPU more than memory.
Examples
- Database slows down due to I/O limits -- A slowdown gets tracked back to the database. The database server doesn't show high CPU, nor is it using enough memory for significant swapping. But the %iowait/%wa numbers are high, and
iostat -x 1shows high %util (>60%), await, and avgqu-sz. I/O bandwidth/throughput is likely the limiting factor in this case (and, unfortunately, hard to fix quickly). - Database slows down due flushed working set -- Another case of database slowdown is when you have more data than can fit into memory at one time. A bad query can cause less commonly-used data to get pulled off of disk into memory, replacing more commonly-needed data. This is usually seen with an increase in disk I/O following the bad query. This will resolve itself eventually, but preventing it from happening again is important.
Examples
- FreeSwitch server leaks file descriptors -- Every call through a FreeSwitch server allocates several file handles (mostly network sockets and epoll descriptors, but could include files as well for media). If calls are not properly terminated, the resources can leak, creating a file descriptor leak. The symptoms are increased load and low free memory, but nothing is visible taking up much memory (FreeSwitch may be the largest process in
topand only take up, say, 50%). I've also seen this happen in code where network sockets aren't closed or in cases like the Apache async HTTP client for Java if new clients keep getting created without being closed.
Examples
- To investigate this possibility, you find the pid of the process (using something like
ps aux | grep -i freeswitch-- pid will be the number on the left), and runls -l /proc/<pid>/fd. Pipe towc -lto get a quick count.
$ ls -l /proc/51994/fd |wc -l
7497
$ ls -l /proc/51994/fd |head -n 7
total 0
lr-x------ 1 user user 64 Jul 11 10:13 0 -> /dev/null
l-wx------ 1 user user 64 Jul 11 10:13 1 -> /dev/null
lrwx------ 1 user user 64 Jul 11 10:13 10 -> socket:[431434]
lrwx------ 1 user user 64 Jul 11 10:13 100 -> socket:[19160730]
lrwx------ 1 user user 64 Jul 11 10:13 101 -> pipe:[209306381]
lrwx------ 1 user user 64 Jul 11 10:13 102 -> inotify
Examples
- Read-only filesystem -- Sometimes you'll find that there are all kinds of disk errors in the logs. If the server is virtualized or using a network filesystem (such as NFS), check to see if it is mounted read-only. The
mountcommand can help here.
$ mount
/dev/mapper/VolGroup-lv_root on / type ext4 (rw)
proc on /proc type proc (rw)
sysfs on /sys type sysfs (rw)
devpts on /dev/pts type devpts (rw,gid=5,mode=620)
tmpfs on /dev/shm type tmpfs (rw,noexec,nosuid,nodev)
/dev/sda1 on /boot type ext4 (rw)
/dev/mapper/VolGroup-lv_home on /home type ext4 (ro,nodev)
/dev/mapper/VolGroup-lv_tmp on /tmp type ext4 (rw,noexec,nosuid,nodev)
/dev/mapper/VolGroup-lv_var on /var type ext4 (rw,nosuid)
/dev/mapper/VolGroup-lv_var_log on /var/log type ext4 (rw)
/dev/mapper/VolGroup-lv_var_log_audit on /var/log/audit type ext4 (rw)
/tmp on /var/tmp type none (rw,bind)
none on /proc/sys/fs/binfmt_misc type binfmt_misc (rw)
Strange network issues
You may never see this, but sometimes two systems get the same IP address. Sometimes a VM's ARP packets won't get properly forwarded to other VMs on the same host. Here are a few tools that can help:
ping-- check for connectivity to another IPtraceroute/tracepath-- follow the path to another IP, can be used to find where a problem is, or make you wonder why the packets are going through THAT link
Strange network issues
tcpdump / ngrep-- both good for looking at the actual network traffic that is happeningtcpdumpis better if you want to see TCP flags or decode a binary protocol.ngrepis usually nicer for plain-text protocols since it has simplegrep-like functionality for searching text- I like running ngrep with
ngrep -W byline -qt -d <device> <string to grep>(possibly with-vor-iflags just likegrep) Example:ngrep -W byline -qt -d eth0 'HTTP/1.1 [45]'
- I like running ngrep with
Strange network issues
arping-- if you runarping <my-ip>and get a response back (you generally won't), verify that the MAC address is yours. If not, bad times. Also, responses from more than one MAC address are no goodarp -a-- should show all hosts that you try to talk to on your Ethernet segment (so, not through a layer 3 device like a router)
Summary
- Trace the issue through the system to find a target for analysis (or use your metrics to find out what is in trouble)
- Check logs and major resources (CPU, memory, disk I/O, network) to look for errors or saturated resources
- Come up with (and refine) a process that works well for your system so you can mechanically find the issue without panic
- After the initial problems are fixed, do a retrospective to come up with a plan to avoid them in the future
Questions?
Contact:
- Email: jeff@jeffpoole.net
- Twitter: @_JeffPoole
- Talk Feedback: https://joind.in/talk/66825
(Please give feedback!)